


The Exit Bottleneck: How High Purchase Prices Are Trapping Private Equity Capital
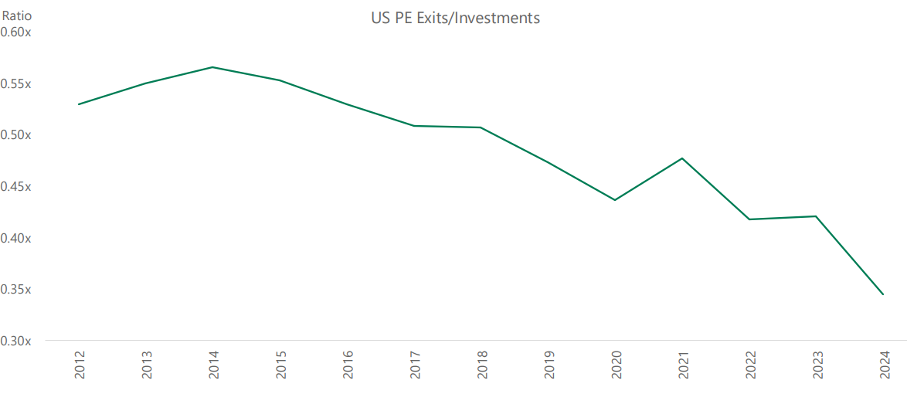
Between 2014 and 2024, the ratio of exits to investments declined from 0.55x to 0.35x. Inverting this ratio suggests that PE firms are now investing nearly 3x more capital than they are exiting, a record high. This trend presents a critical question: is the glass half full, indicating that firms have been deploying abundant dry powder, or half empty, suggesting an inability to exit investments at their desired terms?
Insight into this question can be found in the second chart. PitchBook data from 2014 to 2022 reveals a clear trend since 2017: portfolio companies acquired at higher multiples are taking significantly longer to exit compared to those purchased at lower multiples (as shown by the comparison of the grey and blue bars).
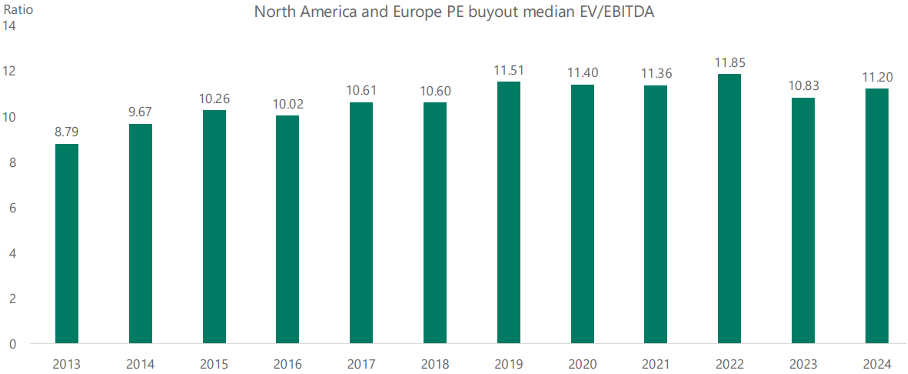
The third chart indicates that the issue is likely not due to unfavourable exit valuations, which actually increased slightly between 2020 and 2022. So the root cause appears to be the high valuations at the time of initial investment.
Sources:
Bradley, J. (2025, July 22). PE’s gap between investments and exits reaches a decade high. https://pitchbook.com/news/articles/pes-gap-between-investments-and-exits-reaches-a-decade-high
Slok, T., Shah, R., Galwankar, S., & Apollo Global Management. (2025). Outlook for private markets. https://www.apolloacademy.com/wp-content/uploads/2025/10/Private_Markets_100425.pdf
Sløk, T. (2025, September 19). Buy low, sell high is a superior strategy – Apollo Academy. Apollo Academy. https://www.apolloacademy.com/buy-low-sell-high-is-a-superior-strategy/