

With the recent market turmoil that took place across various continents, the word that appeared on everyone’s mouth was the VIX index. Although this financial term is well know among professional investors, its operation remains complicated. This article therefore has three goals, understanding the history behind this index, its way of working, and the reason behind its recent agitation.
History of the VIX index:
First of all, this volatility indices was first introduced in 1993 by CBOE and was designed to measure the volatility of the S&P 100. However, in 2003 as the focus shifted to the S&P 500, it was updated in collaboration with Golden Sachs in the aim of representing a broader view of the market. This change made the index more accurate in its prediction of asset prices fluctuation, most commonly known as volatility. Understanding market volatility is critical when assessing market risk (higher volatility typically implies higher uncertainty about price movements) is crucial when evaluating portfolio risks and asset allocation. While there are two type of volatilities, historical volatility and implied volatility, the VIX index mainly focuses on implied volatility, which is derived from market prices and options, to provide insights on what markets might expect in the future.
Methodology behind the VIX index:
As a whole, the CBOE Volatility Index is simply a real-time index that measures the magnitude of price movements of the S&P 500. However, its calculation method is not that simple. First of all, it is important to chose the correct S&P 500 index (SPX) options, which must contain a constant maturity of 30 days, this must involve choosing near-term as well as next-term options that will not expire the same day to ensure more accuracy when measuring future volatility. Secondly, you also need to use different interest rates for near-term and next-term options which make it easier to account for changes in interest rates over time. These interest rates are derived from the U.S. Treasury yield curve. Finally, you need to combine the variances by using a weighted average, and adjust them for a 30-day period. This gives you a result expressed as an annualised percentage, which makes it easier for investors to compare these results to other volatility measures.
What happened on the 5th of August?
By now, you might be wondering why are we talking so much about the VIX index recently? Well, we a hearing about it because it hit its highest level since the market plunge of 2020 due to the Covid-19 crisis, as seen on Figure 1:
Figure 1: CBOE Volatility Index (source: Yahoo! Finance)
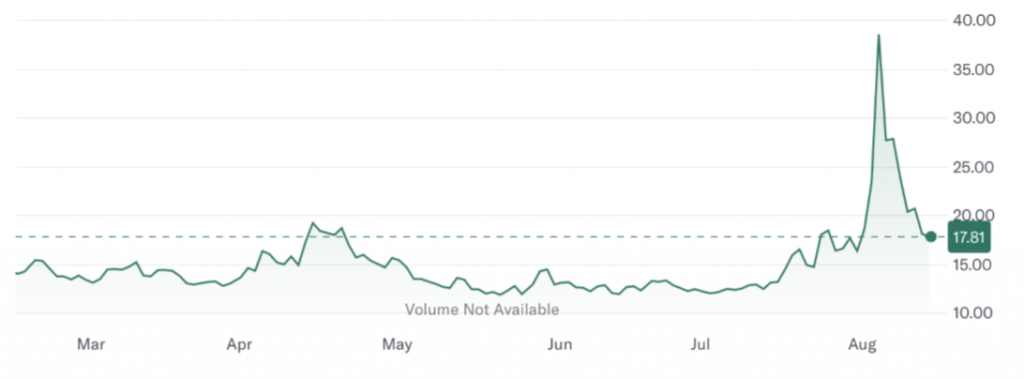
The spike observed in the “fear gauge” can be retraced through a combination of global economic concerns as well as market-specific factors that increased investor anxiety. The main reason is undoubtably due to a weakening U.S economic data. The July 2024, the U.S. jobs report was disappointing, with an increase of non-farm payrolls of 114 000, which was significantly below expectations. Couple this with the rise in unemployment rate to 4.3%, and you get a spark of fear among investors of a possible recession in the U.S. economy, leading a surge in the search for safe assets, which contributed to more volatility.
In addition to this, the Bank of Japan also played its part in the market turmoil as the surprise increase in interest rate disrupted the popular yen “carry trade” strategy (which involved borrowing at low interest rates in Japan to invest in higher yield assets in other markets) as the rate hike caused the yen to grow stronger, causing sell-offs when traders were met with margin calls.
Thirdly, both reasons stated above also led to a global asset sell off, causing a significant decline across global stock markets, with the Nikkei 225 falling by over 12%, the S&P 500 experiencing steep losses, and South Korea’s Kospi index declining sharply to the point of triggering a trading halt.
Finally, all of this is also met by a weakening tech sector in the U.S. with the so-called “Magnificent Seven” losing around $3 trillion in market capitalisation. As these companies constituting more than a third of the S&P 500, the slide they had been experiencing for weeks was bound to heavily impact the U.S. market.
Key Conclusions:
Although the VIX index has now come down from its spike at the beginning of August, it does highlight a few important lessons on investor sentiment. First and foremost it implies a growing risk aversion among investors, with a shift from equities (particularly in the tech sector) towards safer assets like bonds of commodities. This could indicate a broader loss of confidence in the market. Secondly, in itself the rise of the “fear gauge” also underscores a heightened concern among investors about short-term outlook for financial markets. Finally a key takeaway is that fears of economic slowdown, interest rates uncertainties, and geopolitical risk suggest market instability could persist until investors gain more clarity on these issues.