



Abstract. Brexit is arguably one of the most consequential events in Great Britain’s recent history but assessing exactly how it affected the country’s economy is difficult because there is no direct way to observe what would have happened had Great Britain remained in the European Union. This paper addresses this problem by comparing local economic activity on either side of the border between Northern Ireland and the Republic of Ireland. Comparing communities close to the border helps control for the demographic, cultural, and economic differences that would otherwise confound a broader UK-versus-Ireland comparison. Because official GDP statistics are not available at a fine enough geographic scale to support this kind of comparison, the paper instead uses nighttime light data collected by NASA’s VIIRS satellites as a proxy for local economic activity, building on prior research showing that changes in night light are correlated with changes in GDP. The border region is divided into a grid of 424 one-kilometer cells on each side, and the change in light radiance within each cell is measured between 2012 and 2024 — before and after the 2016 Brexit referendum. My findings indicate that radiance grew at statistically indistinguishable rates on the Northern Irish and Irish sides of the border before and after 2016, suggesting that Brexit has not measurably slowed economic growth in the UK side relative to the Irish side. Beyond this substantive finding, this paper provides a template for using satellite data to study other policy changes, extending border-discontinuity designs to settings where official statistics are too coarse to support them.
I am grateful to Professor Ernesto Dal Bo (UC Berkeley) for useful comments on an earlier draft.
- Introduction
Brexit is arguably one of the most consequential events in Great Britain’s recent history but assessing exactly how it affected the country’s economy is difficult. The central challenge is that the relevant counterfactual — how Great Britain’s economy would have evolved had it remained in the European Union — cannot be directly observed: that alternate version of events simply doesn’t exist to measure. One can measure what happened to Great Britain’s GDP after Brexit, but assessing Brexit’s actual effect requires comparing that outcome to what would have occurred in its absence.
One possible approach would be to compare Great Britain’s growth since Brexit to that of another country, using it as a benchmark. Ireland is a natural candidate, given its geographic and economic proximity to Great Britain. This approach is imperfect, however, because Great Britain and Ireland have important demographic, cultural, political and economic differences. A naïve comparison between the two countries therefore risks attributing pre-existing differences to Brexit, when in fact those differences existed independently of it.
This paper addresses this problem by focusing on the communities near the border between Northern Ireland and the Republic of Ireland. By comparing communities within twenty miles of that border, on both the British and Irish sides, I hold constant many of the cultural, demographic, and economic characteristics that would otherwise confound a broader UK-Ireland comparison. These border communities formed a single, shared economic and social space prior to the 2016 Brexit referendum, and this study tracks how each small area changed over time after 2016. The resulting estimate comes closer to isolating the causal effect of Brexit than a comparison of national aggregates would allow.
Implementing this border-based design, however, requires a degree of geographic detail that official GDP statistics do not provide, as national and regional figures cannot be disaggregated to the narrow strip of territory on either side of the Irish border that my design demands. My main methodological contribution is to address this data limitation using an underutilized source: nighttime light radiance recorded by NASA’s VIIRS satellites. Prior research, most notably Henderson and Storeygard (2012), has shown that changes in nighttime light emissions serve as a reliable proxy for changes in GDP, though this approach has been applied almost exclusively at the national level. This paper extends that method to the sub-national level, dividing the border region into a grid of 1-kilometer cells on each side and measuring the change in radiance within each cell between 2012 and 2024. Because satellite light data can be measured at virtually any spatial resolution, they allow for the construction of a geographically granular panel of local economic activity in a setting where no comparable official statistic exists, rendering an otherwise infeasible empirical strategy tractable.
My results indicate that radiance grew at statistically indistinguishable rates on the Northern Irish and Irish sides of the border before and after the 2016 referendum, suggesting that Brexit has not measurably slowed economic growth in the UK side relative to the Irish side. Beyond this substantive finding, this paper provides a template for using satellite data to study other policy changes, extending border-discontinuity designs to settings where official statistics are too coarse to support them.
- Historical Context
The idea of the UK’s exit from the European Union was not a novel one – it had been debated in British politics for decades. In 2013, UK Prime Minister David Cameron announced that in the case of a Tories’ victory in the 2015 general election, a referendum on EU membership would be held. After his election victory, as promised, Cameron established a 2016 date for the referendum. The “Leave” campaign focused on a generally populist message centered on immigration, the financial burden of contributions to the EU, and the nation’s legislative independence. It framed the UK’s membership in the EU as a weight on the country’s potential, and implied that the UK would be better off had it not been responsible for the well-being of fellow European nations. The “Leave” campaign unexpectedly won with a margin of less than 2%, prompting visible economic shifts in the UK’s public finance as well as private investment.
In January of 2017, Prime Minister Theresa May enacted Article 50, a piece of legislation that officially began the formal process of separating the UK from the European Union. Negotiations were held between the UK and the European Union from 2017 to 2019, which rendered the economic climate in both the UK and the European Union relatively uncertain, as the exact terms of Brexit remained to be determined.
The Bank of England estimated the change in business-related investments during the period of the negotiations to be in the order of £100 billion, yet it is unclear how many of these investments were actually cancelled, or simply temporarily paused, and how many were reinstated in the following years. Foreign direct investment dropped during this time, from £249 billion as of 2015 to £98 billion by 2017. Major financial institutions began relocating operations to ensure continued access to European markets, although permanent investments with high upfront costs were seldom affected. Global banks established EU hubs, partially diverting operations away from the UK. Many of these assets, however, were the most malleable and easiest to move, and their relocation could have simply been a temporary change with limited long-term effects.
The contract between the UK and the European Union, laying out the legal and financial terms of Brexit, which was finalized in late 2018 and was later amended in early 2020, laid the foundation for the legality of Brexit. It included a transition period extending to December 2020, during which the official relationship between the European Union and the United Kingdom did not undergo significant changes. Following this period, a second phase of the exit was put in place, also known as the Trade and Cooperation Agreement, signed in late 2020. This agreement became the primary ‘constitution’ for Brexit, outlining the process and its objectives. A free trade agreement, which did away with tariffs on goods as well as introduced customs procedures and new regulations, was introduced, eliminating the previous pre-Brexit regulatory alignment, yet maintaining some level of temporary free trade. The agreement removed the legal supremacy of the European Union over the United Kingdom, which officially restored full sovereignty by Parliament over the United Kingdom.
The Northern Ireland Protocol, which was later replaced by the Windsor Framework, ensured a legal arrangement keeping Northern Ireland partially aligned with EU regulations and trade laws, although many of Brexit’s changes still were enacted in the region. Although the movement of goods between Northern Ireland and European Union member countries was significantly less regulated, a significant portion of Brexit’s measures, such as legal sovereignty, European Union citizenship status, and relation to EU political institutions, remained in place. For the purposes of this paper, it is important to note that for the most part, investors and institutions outside of strictly import and export businesses treated Northern Ireland similarly to the greater United Kingdom.
- Data and Methods
3.1 Data
The first innovation of this study is the use of night light data from the dataset as a proxy for economic growth at the sub-national level. Previous studies have used nighttime light data as a way to measure GDP at the national level. One of the main papers in the literature is Henderson and Storeygard (2012), which demonstrates that as local incomes rise, so does local light usage per capita. Its main conclusion is that growth in light pollution in an area is strongly correlated with growth of GDP in that area because increased economic activity usually implies higher demand for the usage of light. Light and energy are a major expense worldwide, and growth over time in the disposition of a locality to consume energy is a good indicator of growth of its spending capacity.
Henderson and Storeygard (2012) use light pollution data from US Air Force satellites paired with official GDP data reported by the observed country and worked backwards from the raw radiance values in comparison to official GDP data to determine the conversion between light and GDP. To estimate the conversion between measured light pollution values and the known official GDP data for that location, they use the equation Z = ψx + ε, or Measured GDP growth = ψ × light pollution growth + error, where Z is the official measured GDP growth as reported by the country observed, and x is the measured light pollution’s growth. The constant Psi represents the slope of the line relating GDP to light pollution values, measured with the standard formula: =Cov(x,z)Var(x), where the numerator is the covariance of the lights and GDP, in other words, how closely those two variables match each other’s growth. The denominator is the variance in the growth of the lights. The ratio between covariance and variance is the Psi variable.
To provide a sense of the magnitude of the implied measurement error, Henderson and Storeygard (2012) compare estimates based on a subset of countries with high-quality GDP data with estimates based on a subset of countries with low-quality GDP data. In estimates based on the former group, Psi was found to be close to 1, indicating that light pollution increases one-to-one with GDP, while estimates based on the latter group yielded a much lower value for Psi. The classification was done based on a widely accepted estimate of GDP reliability by country, one that classifies GDP measures in tiers and overlaps those over possible Psi values between 0.1 and 1. For that reason, a highly reliable country may have a Psi value of 0.8, as the majority of light pollution data matches reported GDP values, while a country with Psi equaling 0.2 may be very unreliable in its official reports. Since their paper concludes that the relation between GDP and light pollution can be different in developing countries and developed countries, for this study, I used developed countries’ estimates. The Henderson and Storeygard (2012) paper also find heteroskedasticity, meaning that the variance of the residuals changes with the level of the predictor (light pollution).
The main source of nighttime light data for this paper is the data set collected by the satellite system called Visible Infrared Imaging Radiometer Suite (VIIRS), a meteorological NASA system designed to observe snowpack, ocean color, and temperature, land and surface temperatures, and cloud aerosol. Through the Google Earth Engine, an extension of Google Earth, “VIIRS Stray Light Corrected Nighttime Day/Night Band Composites Version 1” provides monthly average light pollution values from anywhere on the globe. The Day/Night sensor is extremely sensitive to low light, allowing it to capture even faint streaks of light. In nighttime measurement, the satellite uses a High Gain Stage, meaning its sensitivity to light is the highest possible. VIIRS satellites measure black and white panchromatic wavelengths through a radiometer, capturing infrared rays from Earth, and converting them into pixel radiance values, which are stored in the data set as numerical values and visually displayed on the Google Earth map. The satellite measures radiance in the standard formula for radiance at an extremely small level: L=A⋅cos(Θ)⋅Ω, where L is the radiance, Phi is the radiant flux in nanowatts, one of the smallest units of measurement of light and energy, A is the projected surface area in cm2, and Theta is the angle at which light moves relative to the Earth’s surface. Lastly, Omega represents the solid angle in steradians, or the area of a spherical cap in cone shape widening outwards from the satellite tracking light rays coming in the direction of the sensor, all divided by the radius squared.
The dataset measures the radiance values for every point individually several times per month and then averages the same point’s values from the measurements in the same months. After each point has a monthly average, the mean of those points is used to find an overall result for the desired domain, averaging over years if needed. The satellite itself also corrects for stray light –namely any light which comes from the sun and is not produced from the Earth’s surface –and does so by capturing a baseline of light interference over oceans which are known to have zero radiance, allowing for the assumption that any radiance coming from these areas is interference. These approximate interference values are then subtracted from all values captured as a constant, correcting off values, and do so in correspondence with the satellite’s angle in relation to the Earth. These measurements are captured by the satellite. Further calculations happen on demand in Google Earth Engine, the platform that processes and publicizes these measurements.
Note that the images displaying light pollution overlaid on the globe are not images as would be captured on a camera lens, but rather a highly accurate composition of accurate radiance values. The satellite can perceive up to around 740 meters in resolution, meaning that at maximum resolution each pixel is around three-quarters of a kilometer, and is converted to around 460 meters when overlaid on a finer geographic map by the Colorado School of Mines. Although this zoom capability and resolution are more limited than a regular Google Earth map, it acts as an early barrier to outliers, as single homes and buildings do not alone act as data points; all data points at their smallest, most granular level are clustered together and, by consequence, averaged out.
To access the data in this data set (VIIRS Stray Light Corrected Nighttime Day/Night Band Composites Version 1), JavaScript code was entered into the dataset interface, Google Earth Engine. The code that I used loads the data set, performs the requested task and produces and estimates (Figure 1). I used Claude in “extended thinking” mode. To ensure the validity of the code, all lines of codes were cross-checked using ChatGPT and Gemini.
3.2 Statistical Methods
Estimating the effect of Brexit on the UK economy is difficult because it is difficult to quantify the change in GDP that would have occurred in the UK had Brexit not taken place. While I can use actual data to measure the change in UK’s GDP that took place after Brexit, in order to isolate the causal effect of Brexit I would need to compare it to the counterfactual change that would have taken place in the absence of Brexit. A comparison of the change in GDP in the United Kingdom before and after Brexit with the corresponding change in the European Union would likely yield an incorrect estimate of the effect of Brexit if there are pre-existing differences in economic fundamentals. For example, even in the absence of Brexit, the United Kingdom and the European Union could experience differences in economic growth due to differences in industry composition, demographic trends, immigration flows, cultural attitudes, etc. In this case, a naïve comparison of GDP growth in the United Kingdom and the European Union would pick up not just the effect of Brexit, but also the effects of these confounding factors.
For this reason, this study focuses on the only land border between the European Union and the United Kingdom, namely the border between Ireland and Northern Ireland. It compares economic growth in UK communities just North of the border with growth in Irish counties just South of the border. Specifically, this study focuses on a stretch of land encompassing 20 miles from the border line in both directions. This restricts the sample to areas in proximity to the border, meaning that both sides share the same cultural, demographic, religious, and economic makeup, apart from differing nationalities. The proximity of the two sides and the pre-Brexit ability of residents to move freely between the two sides likely erased major socioeconomic or cultural differences between the two sides. Additionally, given the pre-Brexit European Union alignment between all member countries, it is unlikely that there were significant legal differences between the two countries pre-Brexit, meaning that both sides were subject to similar regulatory, fiscal, and legislative conditions.
The key implication of focusing on communities near the border is that the estimates in this study isolate the causal effect of Brexit. If there are no significant pre-existing differences between the two sides of the border, then any difference in GDP growth after Brexit can be attributed to the effect of Brexit alone. Unlike a comparison of the whole UK with the whole EU, a comparison of these border areas is an apples-to-apples comparison. Spatially granular light data described above allow focusing on the areas in the proximity of the border. While standard measures of GDP for Northern Ireland and Ireland are available at the national level, such measures lack the geographic detail to be able to focus on a specific strip of land around the border. By using light data, this study is able to hold constant nearly all major variables that could influence economic activity beside Brexit.
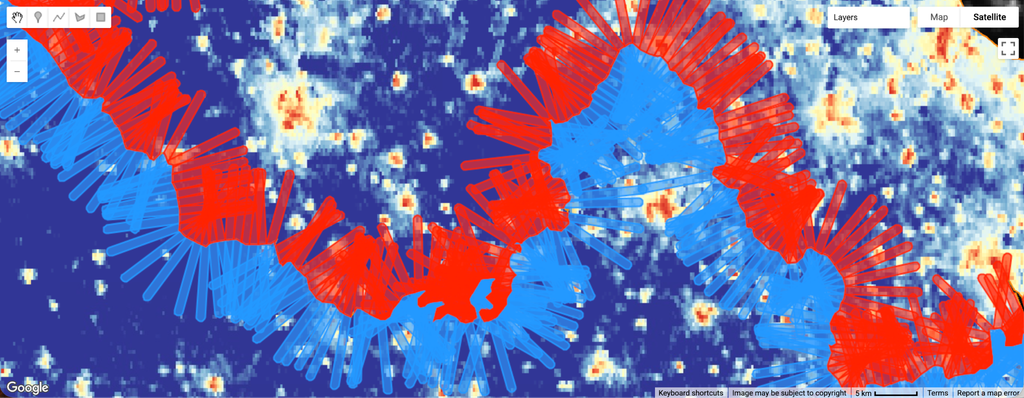
In practice, I divide the area near the border in into 1 km wide cells, one on each side of the border. Each cell on the Irish side is compared to its closest counterpart on the Northern Irish side. This comparison is better than an alternative comparison based on the two overall means of all the cells on each side of the border. While the latter would implicitly compare communities that are far apart from each other, my approach ensures that each cell on one side of the border is only ever compared to a cell adjacent to it on the other side of the border, adding to the credibility of my results.
There are 424 cells on each side of the border, making 848 total data points. I use data for both “before” and “after” Brexit. Specifically, I observe the change in light pollution values between 2012 and 2024. The VIIRS dataset begins in 2012, which was chosen to measure GDP “before” Brexit because it is early enough for GDP not to be polluted by investors’ expectations of Brexit. In principle, expectations by investors of Brexit could have affected GDP even before the vote. Choosing 2012 to measure GDP “before” Brexit – two full years before the vote – guarantees that my measure of GDP is not affected by expectations. In addition, it should also be noted that Brexit was a complete surprise to pundits and investors alike, and therefore, not many investors are likely to have shifted their investments in the years leading up to the vote. My “after” measure is for 2024, the latest possible full year available in the dataset. Although many of the impacts of Brexit may evolve and take effect over longer periods of time, any current study on its effects today must use the most recent data possible to estimate its impact. This study uses one dependent variable, namely the change between before (2012) and after (2024), as opposed to yearly measurements. The motivation for this choice is that the introduction of Brexit policies was gradual, and the chaotic evolution and impact of a lengthy list of measures from its approval in 2016 to its finalization around 2021 would make any results from those in-between years incredibly susceptible to error and would significantly limit the study’s ability to distill a causal link between Brexit and shifts in economic activity. By focusing on a clear before-and-after comparison, a clean and reliable cause-and-effect relationship is established, grouping every aspect of Brexit into one factor and evaluating its overall impact. This is because when referring to Brexit, most refer to all facets and events related to the UK’s exit from the EU, and distinguishing between these would not only be unfeasible but would also reduce the scope of the experimental question by narrowing it down.
As argued above, the geographical proximity of the British and Irish cells should ensure that they are economically and culturally similar. While the lack of preexisting differences between the two sides seems reasonable, it is important to keep in mind that this paper does not simply compare the cells on the Irish side of the border to the ones on the British side. Instead, the paper compares the 2012-2024 change experienced by the British cells to the 2012-2024 change experienced by the Irish ones. In other words, the same cell is compared to itself before and after Brexit. Thus, even if the two areas were not exactly identical in 2012, any pre-existing differences are differenced-out when looking at the 2012-2024 change.
When extracting the desired data from the dataset, Google Earth Engine provides raw values of the light pollution change, and then converts these in the engine to be legible results in the form of a percentage increase. However, to reduce the spread of the curve of all values, the engine was instructed to convert these percentages to logarithms, finding the logarithm of each raw value. This improves the quality of the data, as the tail of the bell curve is compacted towards the median. This is because the difference between extremely large numbers is disproportionately represented by using raw percentage increases, while logarithms treat the distance between values as proportional to their initial and final size. This means that in logarithmic terms, the difference between 1,000,000 and 10,000,000 is the same as the difference between 1 and 10. This normalizes the curve of values and contextualizes some of the differences in change over time, as well as reducing the outliers in the data. The formula used for the change in radiance of the same region over time was: Log change = ln(2012 luminosity + ∈) – ln(2024 luminosity + ∈), subtracting the final luminosity from the initial luminosity. Additionally, given that some pixels in the dataset had at some point zero radiance, which would translate to natural log of 0, which is undefined, this paper introduced a constant in the form of natural log of 1.1, an insignificant number in terms of my overall results, but enough to render all points in the dataset greater than zero.
4. Findings
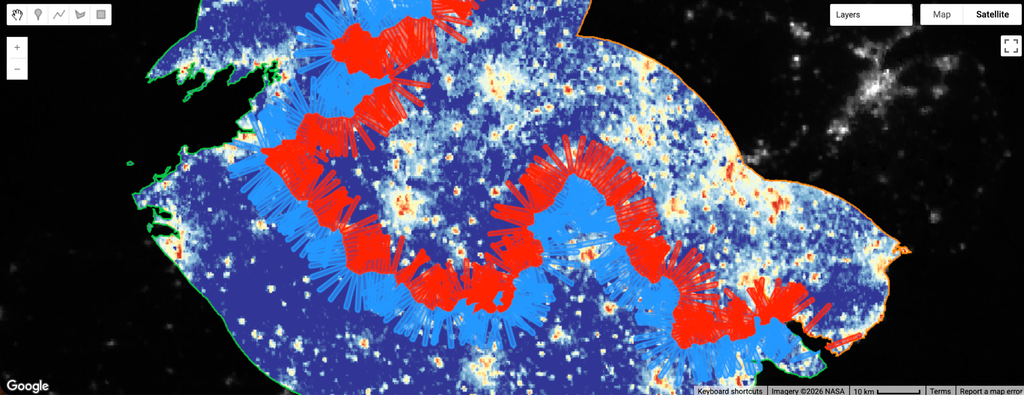
My main finding is that the change in radiance of cells is generally similar on both sides of the border. Northern Ireland ‘s cells’ radiance increased by an average factor of 2.24 times from 2012 to 2024, while Ireland’s cells’ radiance increased by a factor of 2.26 over the same period on average. There is no way to credibly discern the difference between the two, and for all purposes of the study, the two increases can be treated as the same. Using Henderson and Storeygard (2012) approximate conversion, I can divide this factor by 3, giving us roughly a factor of 0.75 for the GDP increase on both sides. This is plausible: official recorded GDP data of both countries match these findings, where per capita GDP did not differ significantly between the two countries, and both countries’ GDP increased over the course of the measured period (Figure 3). In both cases, the median change was higher than the mean, possibly suggesting that the increase in light pollution was fairly uniform across rural and urban areas, refuting the possibility of a few isolated urban areas carrying the overall increase in light pollution. In fact, the raw values show that rural areas increased their radiance more than urban areas. The mean change in radiance went from ~0.51 to ~0.83 nW/cm²/sr, the metric for radiance, yet the median increased from ~0.22 to ~0.59, a more significant change. This is relevant because the mean (in raw value, not logs) gives more weight to the increase in radiance in dense urban areas, while the median gives less weight, as all pixels on the map are spread equally. Therefore, the median raw value of radiance increasing more than the mean indicates that the median, likely a rural location, increased more than the metric which weighs urban areas more heavily. In Google Earth Engine’s map, areas with increases in light pollution are in red, while those with decreased light pollution are in blue and purple.
Overall, these results tell us that as of 2024, Brexit has not impacted the United Kingdom more than the European Union, and instead, both regions have experienced significant economic growth. While this is visible from official aggregate statistics of GDP from both countries, aggregate statistics reflect the impact of Brexit and many other confounding factors. By contrast, my results isolate the impact of Brexit alone and find that as of 2024, there has been no impact.
Finally, to evaluate the precision of my underlying data, Google Earth Engine was instructed to randomly select 15 points in each of the two countries and measure radiance in each one of those points in every month of the year (Tables 1 and 2). This exercise seeks to provide a qualitative sense of how much measurement error there could be in the measurement of radiance. Given that economic activity typically does not vary enormously from month to month of a given year, there should be fairly constant radiance values for the same point from month to month. For each point, Google Earth Engine was then instructed to measure the variance over the year (Tables 1 and 2). For this calculation, the engine used the standard deviation formula. The standard deviation for both sides of the border was low for both 2012 and 2024, although it did change between the two years. Northern Ireland’s mean standard deviation in 2012 was 0.18, while in 2024 it was 0.12, a 31% reduction in variation, meaning more stability. Ireland’s standard deviation increased from 0.139 in 2012 to 0.195 in 2024, a 40% increase in variability. However, although there were shifts in variation, these remain very small fractions of the overall measured radiance, around 3-5% of the overall values. This means that even increasing or decreasing, the variability of the radiance of points remains low and negligible, an indication that the error in light measurements is low, and the foundational database of this study is reliable. This is another indication of the validity of the results of this study.
5. Limitations
In interpreting the results of this study, it is important to consider four potentially important limitations. First, the study estimates the impact of Brexit on the UK economy relative to the impact of Brexit on the Irish economy. Put differently, this study estimates the impact that Brexit had on the UK economy over and above the impact that Brexit had on the Irish economy, whatever the latter was. If Brexit affected Ireland in just as many ways as the United Kingdom, both sides of the border would be subject to the same changes, and therefore, the impact of the policy would not be visible in the data. The experimental question for the study was, however, how much more Brexit has impacted the UK relative to Ireland.
Second, the study assumes that there are no atypical migratory patterns between Northern Ireland and Ireland as a result of Brexit. If Northern Irelanders were significantly more likely to move to Ireland than to other EU countries, given cultural and geographic ties, the migratory effects, which have an impact on radiance, would exaggerate the impact of Brexit in my study.
Another point to consider is the arbitrary nature of the cell divisions, as cells are solely compared to their corresponding cell across the border, but a horizontally adjacent cell is still relevant to the original cell, but is not evaluated. This does not pose major limitations to the study, as the cell’s impact on the results is a net positive, especially given the large sample size of cells, but at a local level data may be misleading as it follows arbitrary geographic divisions.
Finally, it is important to keep in mind that during the implementation of Brexit, the UK sought to minimize trade disruptions between Northern Ireland and the EU. Increased trade frictions are likely to be a major channel through which Brexit damaged the UK economy. By focusing on a region of the UK where policymakers explicitly tried to minimize trade frictions, this paper may underestimate the overall impact of Brexit.
6. Conclusion
This paper seeks to estimate the causal effect of Brexit on the UK economy using a border-discontinuity design and a novel application of satellite-based nighttime light data. By comparing changes in radiance across a narrow band of territory straddling the Irish border, the empirical strategy addresses the identification challenge that has constrained prior attempts to estimate the economic consequences of Brexit – namely, the absence of a credible counterfactual for the UK economy. The results indicate that, as of 2024, radiance grew at statistically indistinguishable rates on the Northern Irish and Irish sides of the border, providing no evidence that Brexit has depressed UK economic growth relative to Ireland.
This finding should be interpreted in light of the limitations discussed above. Because the design nets out any effect of Brexit on Ireland itself, and because the border region under study is one in which policymakers took explicit steps to minimize trade frictions, the estimate presented here likely represents a lower bound on the true national impact of Brexit. The result is nonetheless consistent with official aggregate GDP statistics for both economies over the sample period, lending a degree of external validity to the local estimates produced by this design.
More broadly, this paper contributes to a growing literature that uses nighttime light as a proxy for economic activity. Where Henderson et al. (2012) validate this proxy at the national level, the present study extends it to a substantially finer geographic scale, and finds that the light-GDP relationship remains informative even in areas measured in square kilometers rather than square miles. Future work could extend this design to other borders affected by discrete policy changes, or to shorter time intervals capable of tracing the dynamic path of Brexit’s effects rather than the cumulative change documented here.
Bibliography
“A Bright Idea for Measuring Economic Growth.” American Economic Review.
“GDP per capita, current prices.” International Monetary Fund.
Google Earth Engine. Earth Engine. Accessed May 25, 2026.
Henderson, Vernon, and Adam Storeygard. “Measuring Economic Growth from Outer
Space.” The American Economic Review, April 2012. https://www.jstor.org/stable/23245442.
“Night lights and regional GDP.” Review of World Economics.
“Nighttime Lights.” NASA Earth Data. https://www.earthdata.nasa.gov/topics/human-dimensions/nighttime-lights.
“Northern Ireland’s per-person GDP ‘similar to Poland.'” BBC.
“A sharper image? Estimates of the precision of nighttime lights as a proxy for economic statistics.” Journal of Economic Geography. https://www.jstor.org/stable/26159663.
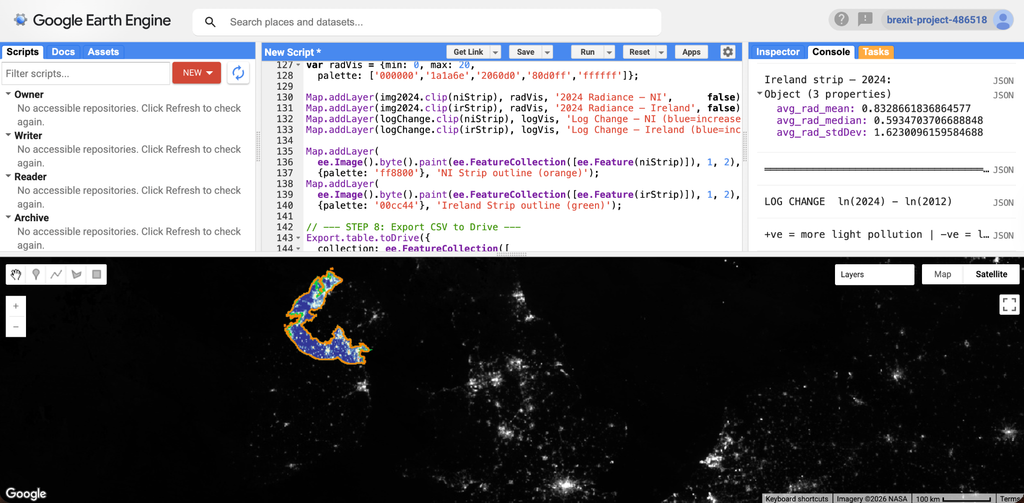
Figure 1: Border strip of Northern Ireland and Ireland border, as visible in Google Earth Engine.
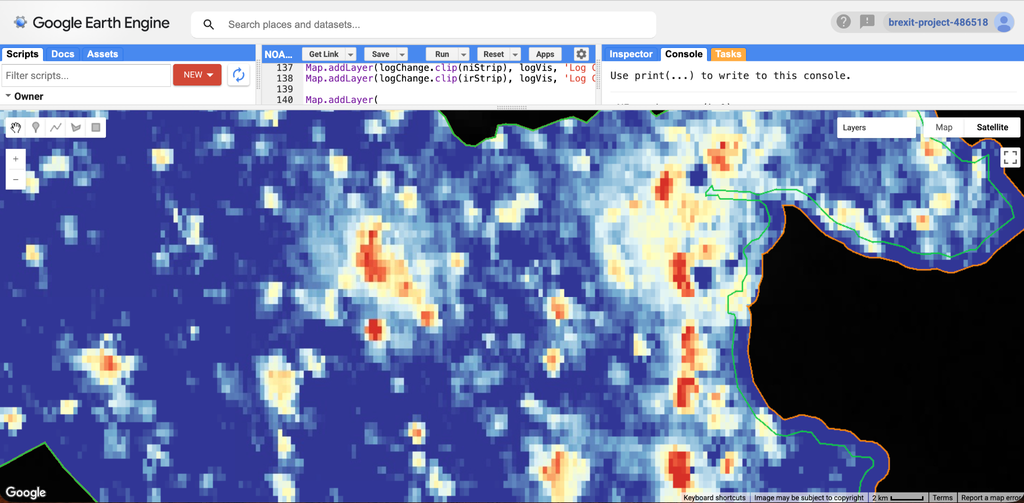
Figure 2: Areas with increased radiance (red and yellow) and areas with decreased radiance (blue and purple)
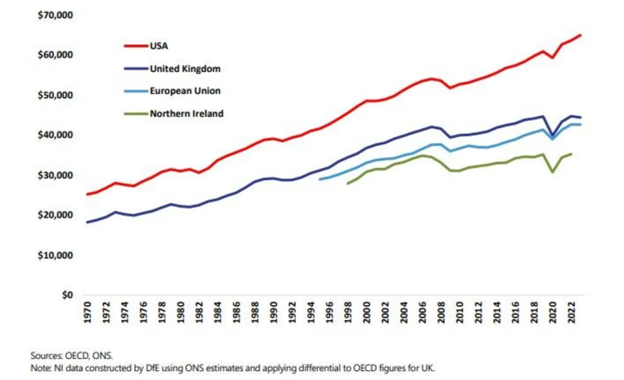
Figure 3: GDP per capita in the UK, Northern Ireland, EU and USA
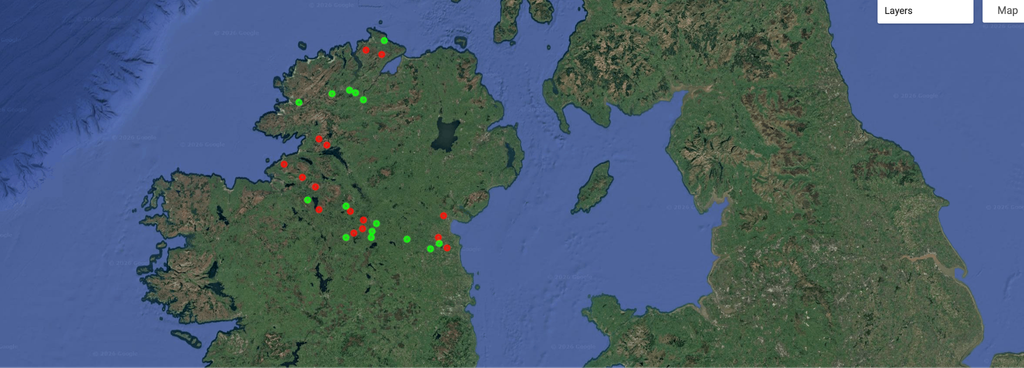
Figure 4: Random points used to calculate standard deviation. Color is coded by country.
A
B
Figure 5: Division of cells on either side of the border. Northern Ireland is red and Ireland is blue.